TLDR
- This is the second in a series of posts on a data analysis of Boston Marathon. The first post focused mainly on particpants and performance. In this post we will look at pacing.
- How do runners pace the Boston Marathon?
- Are there significant pacing differences associated with gender and age? Does ability or finish-time influence pacing?
- How does hitting the wall impact pacing? We will attempt to shed light on these questions using a dataset of more than 70,000 finishing-times for the Boston Marathon.
Introduction
This is the second in a series of posts on a data analysis of the Boston Marathon. The first post focused on particpants and performance. In this post we will look at pacing. How do typical runners pace the hilly Boston course? Are there differences between men and women? How does age influence pacing? Do faster elite runners pace their race differently to slower recreational runners? These are just some of the questions that we will endeavour to answer, or let the data answer.
The dataset contains Boston Marathon finishing times for over 75,000 participants across 2015, 2016, & 2017; a small fraction of records have been excluded (<1%) because of missing timing data or other anomalies. Each remaining race-record includes information such as the gender and age of the runner, their country, state, and/or city of origin, their overall finish-time, and their split-times for 5km intervals along the course.
Segment Paces
To begin, let’s look at the how runners pace the various segments of the race. Since dataset includes timing information for each runner at 5km intervals (approx. every 3.1 miles), which means we can calculate how pacing changes across 9 different segments of the race (5km, 10km, . . ., 35km, 40km, 42.2km).
The graph below shows the pace (minutes per mile), for each of the 9 race segments, averaged over all runners (male and female) in our dataset; we refer to this as a pacing profile because it shows how pacing changes across the course. We see how, on average, men start out faster than 8 mins/mile and gradually slow, eventually hitting about 10 mins/mile at the end of the race, before a final sprint to the finish. The profile for women is similar in shape but obviously reflects different actual paces.
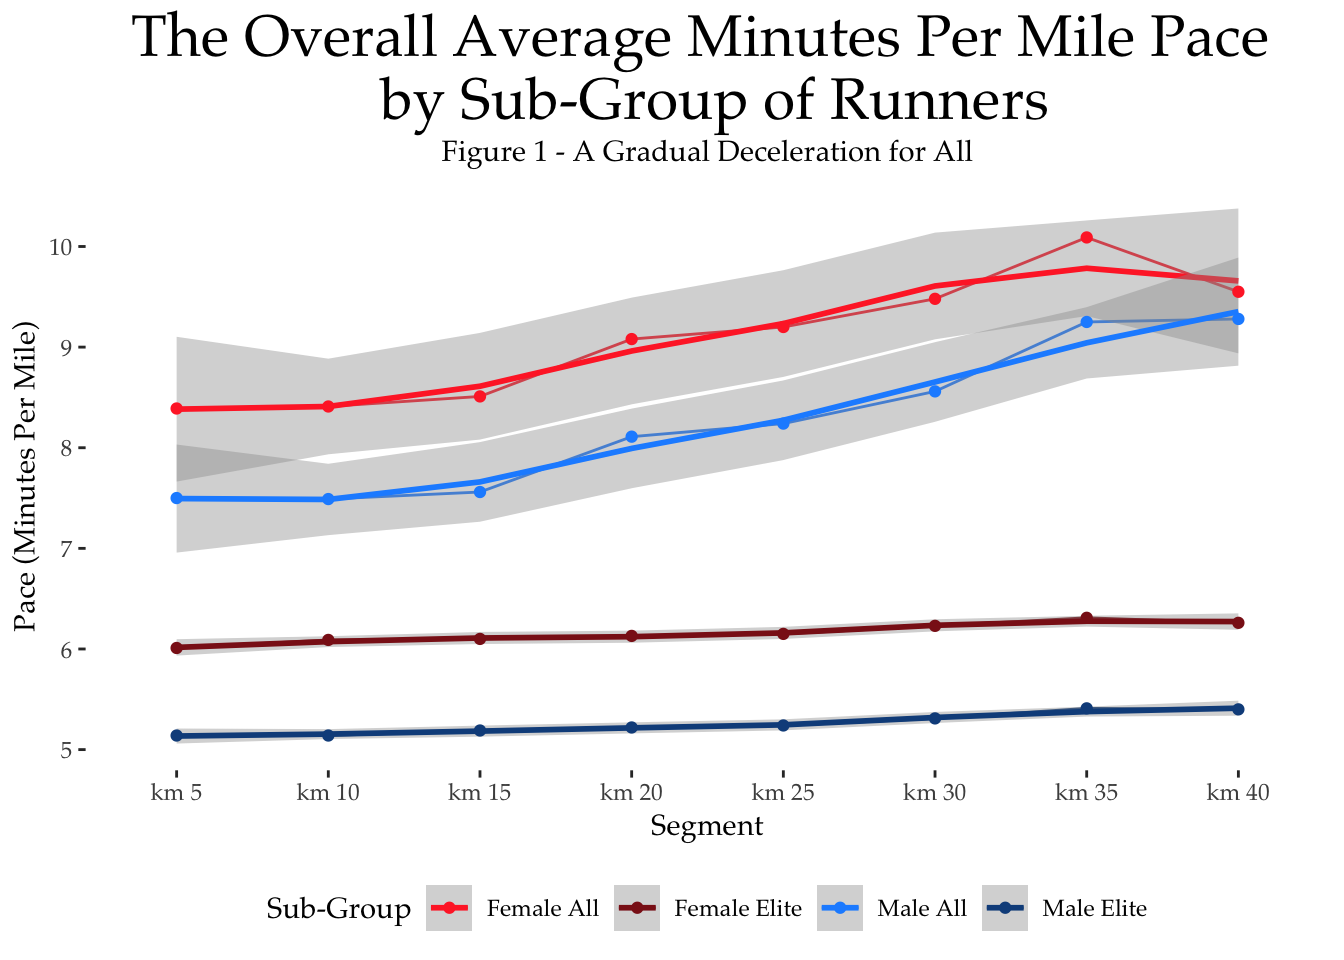
Clearly the average runner slows considerably during the course of the marathon. This is not unusual, especially in Boston, as fatigue and hills take their toll during the second-half of the race. Note,the pacing of the later stages of the race will also be impacted by those runners who hit the wall (HTW); we will return to this presently. Figure 1 also shows the average pacing profile of the top 100 fastest men and women. Obviously these runners are running a much faster race (< 5:30 mins/mile for men and < 6:30 mins/mile for women), but it is also a much more evenly paced race, at least when compared to the average runner.
The Small Matter of Hitting the Wall
In this work we determine that someone hits the wall if their pace in any of the second-half segments of the race slows by at least 33%, relative to their pace during the first-half of the race, but excluding the first 5km segment. We exclude the first 5km segment because it tends to be associated with fairly erratic pacing, due to the excitement of the start of the race, and, as such, provides a poor baseline against which to judge a runner’s marathon pace. Based on this model of hitting the wall, just over 23% of Boston runners hit the wall —they slow by at least 33% for at least one 5km segment during the second half of the race — with men experiencing a much higher rate of hitting the wall (10%) compared with women (4%).
We will return to the issue of hitting the wall in a lot more detail in a future post, for now it is sufficient to know that we have a way to estimate those who hit the wall and, as such, we can separate-out these runners from the pacing profiles to get a clearer picture of how the average runner paces their race, in the absence of a catestrophic pacing event, such as hitting the wall.
## `geom_smooth()` using method = 'loess' and formula 'y ~ x'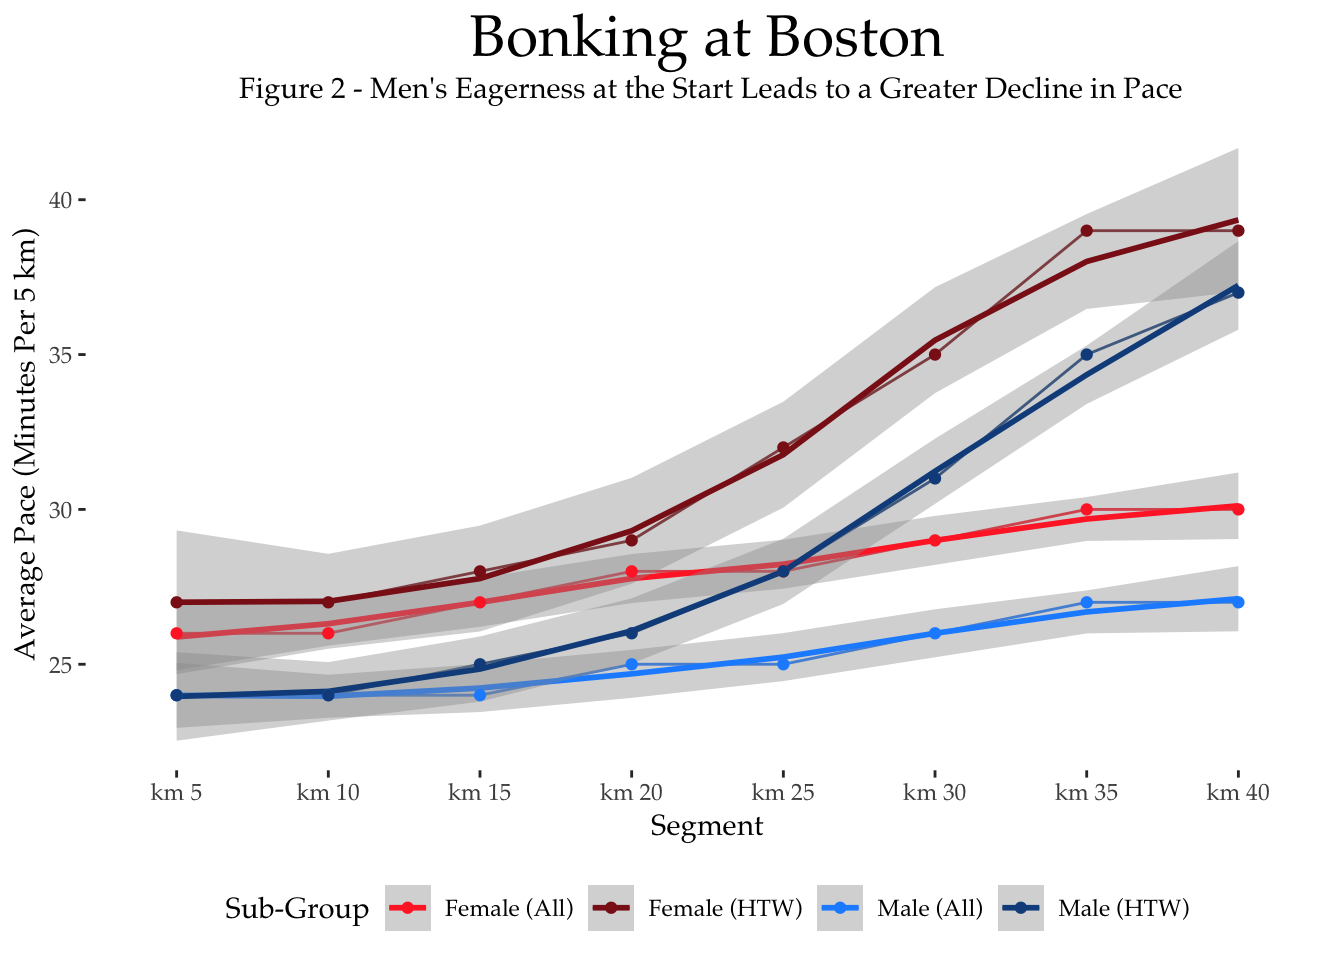
The pacing profiles in Figure 2 do just this: separating runners who hit the wall (HTW) from those who do not. We can see a much more even pacing profile for those who avoid the wall compared to those who hit it. For example, the average male who hits the wall sees their pace slowing to almost 12 mins/mile in the latter stages of the race, compared with just 9 mins/mile for those who do not appear to hit the wall. A similar relative difference in pacing is evident for women, although, it is worth remembering that almost 3-times as many men hit the wall than women.
Relative Pacing Profiles
So far we have looked at pacing profiles based on actual pacing values, measured in minutes per mile. Another approach is to focus on a relative pacing profile by calculating how each segment’s pace varies from the runner’s average race pace. For example if a runner’s average race pace (calculated over the duration of their race) is 10 mins/mile and they run the first 5km at 9 mins/mile then their relative or percentage pace for this first segment is 90%, since they run at 90% of their average race pace (that is, 10% faster than their average race pace).
The average percentage pacing profiles are shown below in Figure 3 for three groups of (male and female) runners: (1) all runners who do not hit the wall; (2) all runners who do hit the wall (HTW); (3) the top 100 fastest runners (Elite). Remember, paces are now percentage paces rather than actual mins/mile and so they are directly coparable across runner groups.
## `geom_smooth()` using method = 'loess' and formula 'y ~ x'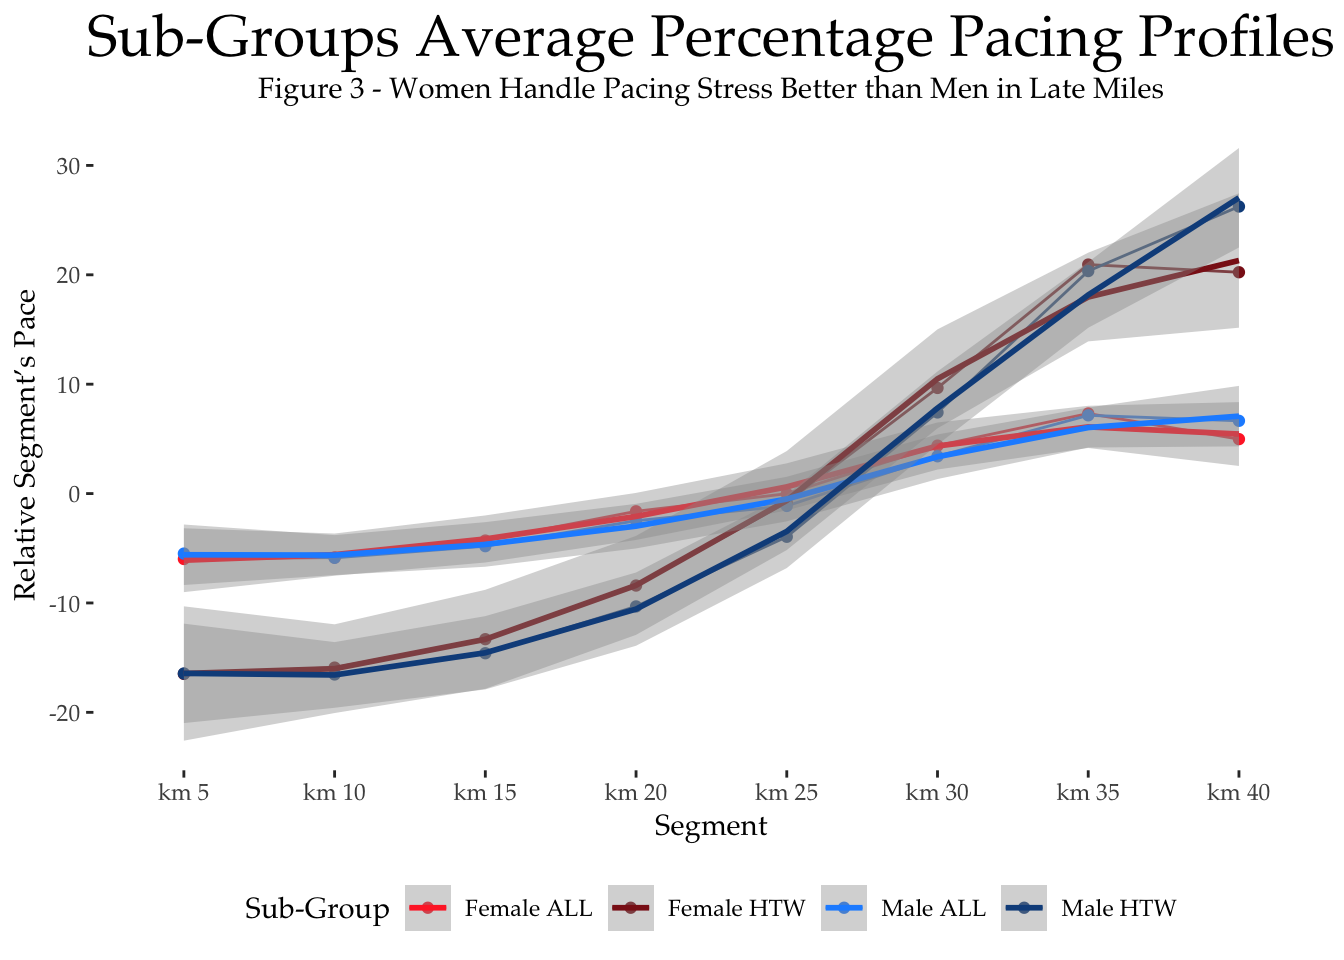
The most important thing to note is the shape of the pacing profile for those runners who hit the wall, compared to those who do not. The former, start their race, on average, about 15% faster than their (eventual) average race pace. Do remember this average race pace will be impacted by hitting the wall, likely exagerting the pace variations of faster early segments.
Regardless, it is clear that starting fast is associated with hitting the wall, as has been previously reported. These runners also slow dramatically in the second-half of the race, slow their pace by more than 20% compared to their average race pace; men slow more than women, relatively speaking.
By comparison, those who do not hit the wall, and the fastest runners in particular, run a much more controlled and evenly paced race. They start a little faster than average race pace, but not too much faster, and they finish a little slower than average race pace, but not too much slower. The average runner maintains a pacing profile that is within +/- 8% of their average race pace; for the fastest elites pacing remains within +/- 4–5% of average race pace.
Pacing Varation
Generally speaking, less pace variation is considered to be a sign of a more disciplined runner, and it is usually associated with a better race. Hitting the wall is one example of what happens when pacing goes very wrong, but obviously there is a contiuum of pace variation across the marathon field. One perspective on this is presented in Figure 3, which plots the percentage pace variation versus finish-time to better understand the relationship between pacing and ability. The precise measure of pace variation that we use is something called the coefficient of variation, which is calculated from the 9 segment paces for each runner. Suffice it to say that a high percentage pace variation means that the runner is changing their pace more that a runner with a low pace variation. In other words, the higher the pace variation the more erratic the pacing.
## `geom_smooth()` using method = 'gam' and formula 'y ~ s(x, bs = "cs")'## Warning: Removed 2496 rows containing non-finite values (stat_smooth).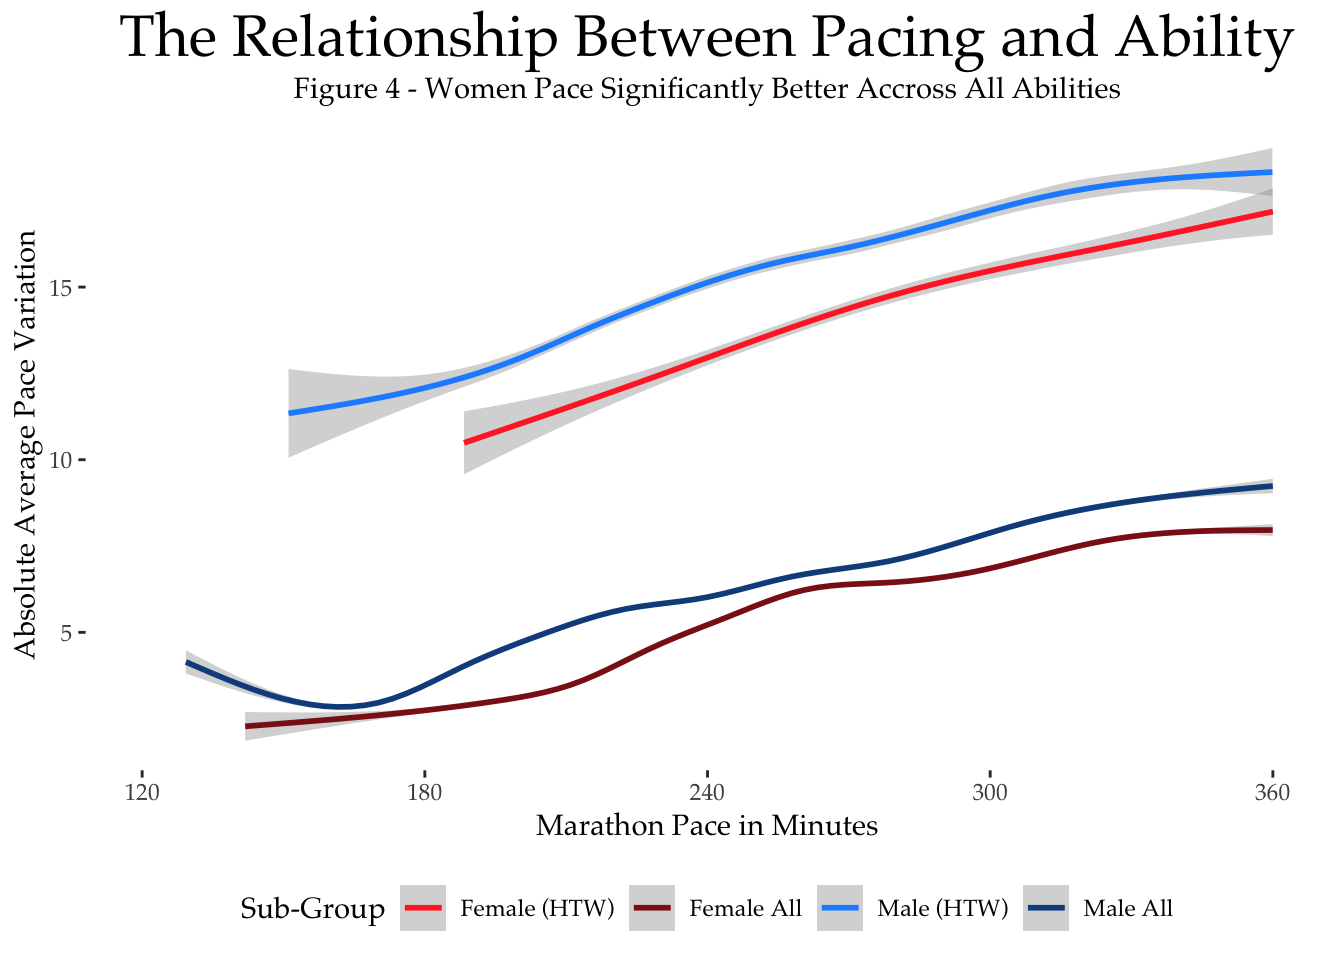
Generally speaking we can see that pace variation tends to increase steadily with finish-times, suggesting that faster, more able, runners are better able to control their pace. As expected, the fastest runners have very low pace variation values and in general women present with less pace variation than men for a given finish-time, a distinction that is greater when we look at runners who hit the wall.
This gender difference in pacing is an important one. In the literature it has been reported that women enjoy more disciplined pacing profiles than men, and while this appears to be the case this year in Boston, it is also true that much of the pacing variation between the genders appears to originate with those who hit the wall. Men who hit the wall tend experience a higher degree of pacing variation (and a larger slow-down) than women and many more men tend to hit the wall, thereby exagerating the pacing difference between the genders when we combine all runners into a single group. By separating those who hit the wall from those who don’t, we can see a more similar pacing regime between the genders when they avoid the wall.
Pacing & Ageing
Finally, let’s consider the relationship between pace variation and age. The graph below shows the average pace variation for men and women across different ages. Once again we separate out those who hit the wall from those who do not. The pace variation for the latter is all but identical for men and women across the ages. For younger runners in their 20’s pace variation tends to gradually decline into our 30s, before growing again steadily if we continue to race into our 60s and 70s. For those who hit the wall there is a similar effect although younger (55) women tend to suffer from less pace variation when they hit the wall than their male counterparts.
ggplot(pacing_variation,
       aes(x = age, y = abs(relative_pacing), color = category)) +
  geom_smooth() +
  scale_x_continuous(
    limits = c(20, 60),
    breaks = c(20, 30, 40, 50, 60)
    ) +
  labs(
    title = "The Relationship Between Pacing and Age",
    subtitle = "Figure 5 - \"You'll Understand When You're Older,\" Holds Truth",
    x = "Age",
    y = "Average Pace Variation") +
  labs(color = "Sub-Group") +
  scale_color_manual(values=c("firebrick1", "firebrick4", "dodgerblue1", "dodgerblue4")) +
  pretty_theme_pace
## `geom_smooth()` using method = 'gam' and formula 'y ~ s(x, bs = "cs")'## Warning: Removed 38784 rows containing non-finite values (stat_smooth).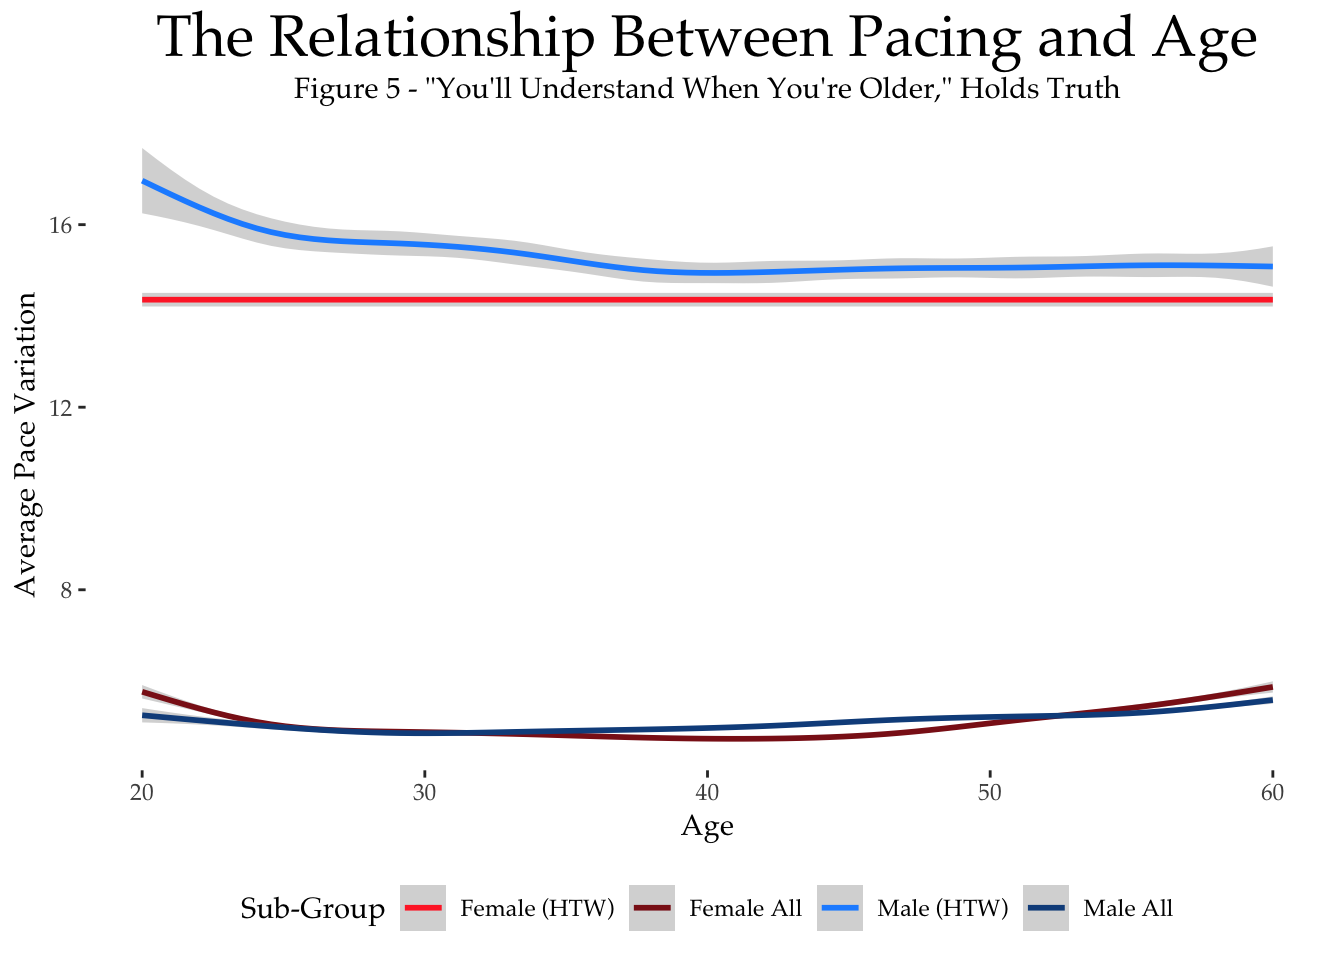
Conclusions
In this post we have analysed the from the Boston Matathon between 2015 & 2017 with a view to better understand the pacing pattersn of runners during the race
The data suggest that many runners adopt a similar relative pacing profile, starting faster than their average race pace and finishing slower.
Those who manage their pace effectively tend to pace within +/-8% of their average race pace. The best of the best do better, maintaining more even pacing within +/-5% of average race pace.
In contrast, those who do not manage their pacing effectively — runners who hit the wall — suffer greatly as their pacing collapses during the second half of the race. The likelihood of hitting the wall is much higher for men.